New Energy World™
New Energy World™ embraces the whole energy industry as it connects and converges to address the decarbonisation challenge. It covers progress being made across the industry, from the dynamics under way to reduce emissions in oil and gas, through improvements to the efficiency of energy conversion and use, to cutting-edge initiatives in renewable and low-carbon technologies.
Lessons from previous energy transitions
17/7/2024
5 min read
Comment

Welcome to the first part of a three-part series exploring the implications of the recently published Energy Institute Statistical Review of World Energy on the pace of the energy transition from Energy Institute Chief Executive Nick Wayth FEI. In part 1, he’ll discuss how energy transitions have occurred historically; what might be the same this time and what might be different. In part 2, he’ll explore a hypothetical version of the world in which the energy transition could be taking place very differently. And finally, in part 3, he’ll try to draw some conclusions on implications for the real world.
We published this year’s Statistical Review just a few weeks ago. And the findings were stark. Although 2023 saw another record year of renewables growth (up 13%, contributing more additional energy than oil and gas combined), both overall energy demand and emissions from energy increased by 2% to new highs. Looking at the overall mix, coal, oil and gas still accounted for over 80% of overall energy consumption.
At a global level, I argued that the energy transition has not even crossed the start line. This provocative statement is not intended to undermine the phenomenal progress that has been made in the last two decades, but it does set out the scale of the challenge.
So, what are the characteristics of previous energy transitions?
First, they take a long time – decades or even centuries – for example, in the UK it took a century for coal to go from 10% of energy in 1560 to 35% in 1660 and to 64% by 1760.1 Similarly, from first oil production in 1848 (in Baku, Azerbaijan) it took until 1960 for oil to overtake coal. And gas has yet to overtake either coal or oil in market share.
Second, these energy transitions have occurred against a backdrop of ever-increasing global energy demand. Over the last century energy demand has grown approximately tenfold – doubling roughly every three to four decades.
Third, because of growing demand, transitions have been about the addition of a new supply, not replacement of the old (with the notable exception of whale oil). The ‘old’ forms of energy have continued to grow in absolute terms. In 2023 we burnt record levels of coal and oil. In fact, as this brilliant chart shows, we even burnt more biomass in 2023 than we did one or two centuries ago!
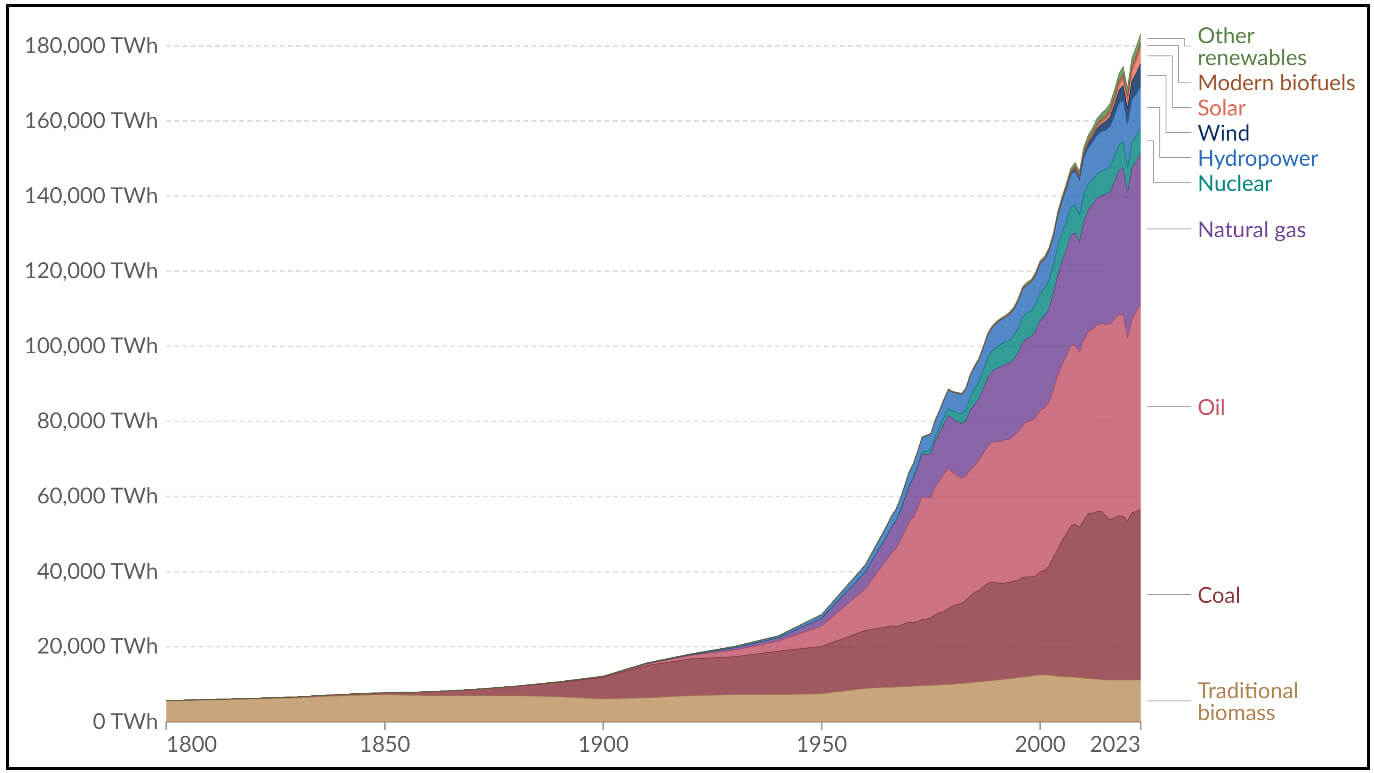
Fig 1: Global primary energy consumption by source
Source: Our WorldInData/energy/CC BY; Data source: Energy Institute Statistical Review of World Energy (2024), Smil (2017)
Note: Primary energy is based on the substitution method and measured in TWh. In the absence of more recent data, traditional biomass is assumed constant since 2015.
So, how might this time be different? The following four big trends are likely to make this time different.
First, whilst at a global level energy demand continues to grow, this masks what is happening regionally. Advanced economies such as Europe and the US are in structural decline for energy consumption. Transitioning an energy system is far easier when overall energy demand is declining, which is why we saw renewables displace fossil fuels in Europe last year but make up just 1% of net additions in India last year.
Second is the very basis of how we measure energy – primary energy – which expresses the energy equivalent of all forms of energy in their fossil equivalent. This made sense in a world which was driven by fossil fuels. In an increasingly electrified world this makes less sense (and something we are reviewing for the Statistical Review).
A petrol engine uses three to four units of primary energy to move a car by one useful unit of kinetic energy (the remainder largely ends up as wasted heat). In contrast an electric vehicle (EV) needs just 1.1–1.2 units of energy to achieve the same useful work. Similarly, a heat pump creates 3–4 units of heat for each unit of electrical energy, whereas even an efficient boiler will only produce 0.8 to 0.9 units of heat for each unit input. Put simply, an electrified world will need far less energy than we use today.
Third, we are replacing a system which has relied on complex extraction of below ground resource, where every reservoir and project is different, to one predominantly based on manufacturing thousands and millions of wind turbines and solar panels. Whilst these still rely on mined minerals and metals, the manufacturing process drives learning and efficiency.
We’ve seen a consistent doubling of renewables every five to six years. In a world of linear changes in energy demand, but exponential growth of renewables, once the inflexion point of fossil displacement is reached the change will accelerate quickly. For example, renewables in the UK took around five years to increase just 1% from 1 to 2% but, in the most recent five years, renewables jumped nearly 15% from 31% to 45%.
In a world of linear changes in energy demand, but exponential growth of renewables, once the inflexion point of fossil displacement is reached the change will accelerate quickly.
Fourth, our sector has yet to undergo the digital revolution that so many other sectors have. Whilst data and artificial intelligence (AI) alone can’t provide the energy we need (and indeed it consumes an increasing share), it will play a massive role in this transition, ultimately flipping the energy sector to from supply push to demand pull. We’ve already seen the impact of National Grid’s Demand Flexibility Service, which saw 2.6 million UK customers reducing demand during the highest peaks least year. Not only did this help balance the grid and save consumers money but it also reduced the need for some of the dirtiest coal and gas-fired peakers to come online. This is just the beginning of what will happen. I’ll write more on this topic in the coming weeks.
All of this put together means that, while we shouldn’t be naïve to the world’s growing energy needs, not least in the global south, there are reasons to believe that the transition is happening and that it will accelerate.
Look out for the second part in this series next week, where I’ll explore how the world’s energy system might have evolved under a very different world order.
1. Allen, Robert C. ‘Energy Transitions in History: The Shift to Coal’. In Energy Transitions in History: Global Cases of Continuity and Change, edited by Richard W Unger, RCC Perspectives 2013, no 2, pp11–15.
- Part 2: ‘What if we imagined Planet Earth as one country?’ In the second of his three-part series on global energy transition, Nick Wayth considers the climate costs of the lack of unity in global energy policy, via a thought experiment.
- Part 3: ‘Getting real about the energy transition’. Nick Wayth concludes his thoughts on the global energy transition by making some suggestions for improvement.