UPDATED 1 Sept: The EI library in London is temporarily closed to the public, as a precautionary measure in light of the ongoing COVID-19 situation. The Knowledge Service will still be answering email queries via email , or via live chats during working hours (09:15-17:00 GMT). Our e-library is always open for members here: eLibrary , for full-text access to over 200 e-books and millions of articles. Thank you for your patience.
New Energy World™
New Energy World™ embraces the whole energy industry as it connects and converges to address the decarbonisation challenge. It covers progress being made across the industry, from the dynamics under way to reduce emissions in oil and gas, through improvements to the efficiency of energy conversion and use, to cutting-edge initiatives in renewable and low-carbon technologies.
Upstream gas flaring emissions drop to 10-year low
27/4/2022
News

Gas flaring activity in the global upstream sector fell last year to its lowest level in a decade due to improved productivity, increased environmental awareness and lower fuel demand caused by COVID-19 lockdowns and travel restrictions, according to recent Rystad Energy research.
Estimates show upstream flaring emitted about 276mn tonnes of CO2 in 2021, down marginally from 283mn tonnes in 2020, continuing a downward trend since the onset of the COVID-19 pandemic (see Fig 1).
Improvements in the US shale sector are a significant driver of the decline in flaring activity, states the market analyst. The tight oil sector, dominated by the US, flared the equivalent of about 12mn tonnes of CO2 in 2021, less than half of the 30mn tonnes seen in 2019. Improvements in the offshore market in Africa are particularly positive from a climate perspective, it adds, including significant reductions in Algeria, both in upstream flaring activity and performance. A continental production decline, as well as reduced output from mature offshore wells, helped lower Africa’s environmental impact associated with flaring.
A rebound in flaring activity is, however, likely this year as global fossil fuel demand increases with the relaxation of COVID-19-related restrictions, and supply remains tight due to sanctions on Russian fuel over its invasion of Ukraine in late February.
‘Flaring represents about 30% of the total CO2 emissions produced by the oil and gas industry, and the practice has come under increased scrutiny over its environmental impact in recent years. Even with the backdrop of the pandemic and supply decline, there are still signs that the latest improvements could be partially sustained,’ says Rystad Energy Analyst Dzenana Tiganj.
Many E&P players have set ambitious targets to end flaring, and for many fields reducing flaring remains the first step on the abatement journey. Through satellite data estimation, Rystad Energy detects and tracks flaring activity globally for all oil and gas fields. Satellite analysis shows that global flaring reduction efforts have not seen any significant effect as flaring activity has remained relatively flat for the past 10 years. However, 2020 marked a step in the right direction, and the 2021 estimates suggest the trend is continuing.
The shale sector’s downward momentum of flaring activity is the most striking reduction in recent years. On a boe basis, tight oil flaring has dropped by 60% from 2019 to 2021. Other onshore production flaring continues to stand out, with flaring intensity exceeding 7 kg of CO2/boe in 2021. The other supply segments show very marginal, almost flat developments.
Regional breakdown
With a clear global downward trend from 2019 to 2021, comparing flaring volumes to pre-pandemic 2019 levels provides an overview of the regional differences in the upstream sector (see Fig 1). Africa, North America, Australia and Europe show persistently decreasing flaring activity, whereas other regions remain flat.
Africa continues the downward trend, with significant developments in the offshore segment. The continent’s CO2 emissions from offshore flaring decreased by 4mn tonnes from 2019 to 2021. This trend is primarily driven by the abandonment of mature assets, production declines for mature assets and increased production from less mature fields.
With production declining from 2019 to 2020, Angola and Nigeria alone reduced offshore flaring volumes by over 2mn tonnes of CO2 and continued with a flat development into 2021. Algeria also delivered significant decreases in overall volumes and flaring per boe in 2021. The estimated reduction totalled 3mn tonnes of CO2, and the intensity dropped from almost 18 kg/boe to 13 kg/boe. This marks a significant shift for a country where the norm has been a steady increase in flaring over the last decade, notes Rystad Energy.
North America has been driving global flaring decreases from 2019 onwards, with shale focusing on operational efficiency improvements. The US continues to make up ground with persistent efforts to eliminate routine flaring at shale production sites and operators communicating better production practices and infrastructural improvements. Satellite data shows substantially decreased flaring volumes and increased on-site utilisation or redirection of gas for other purposes. US shale production contributed approximately 38% of upstream flaring in North America in 2021, compared to 68% in 2019.
Considering all supply segments, including shale, the US continued to perform well throughout 2021, with a decrease of more than 4mn tonnes of CO2 from 2020 and an overall reduction of flaring intensity by an estimated 30%, reaching 1 kg/boe in 2021.
Offshore Europe continues to decrease routine flaring, with the UK being a key driver, reducing flaring emissions by almost 40% from 2019 to 2021. Key operators, such as BP, have implemented improved practices at the well start-up phase and optimised flaring set points to comply with environmental targets and increase fuel efficiency.
While regional developments showcase the global effort to reduce flaring on multiple fronts, the major contributors to global upstream flaring remain the same – namely Russia, Iraq, Iran, Venezuela, Nigeria, the US, Algeria, Mexico, Libya and China – which combined represent over 70% of global upstream flaring emissions. 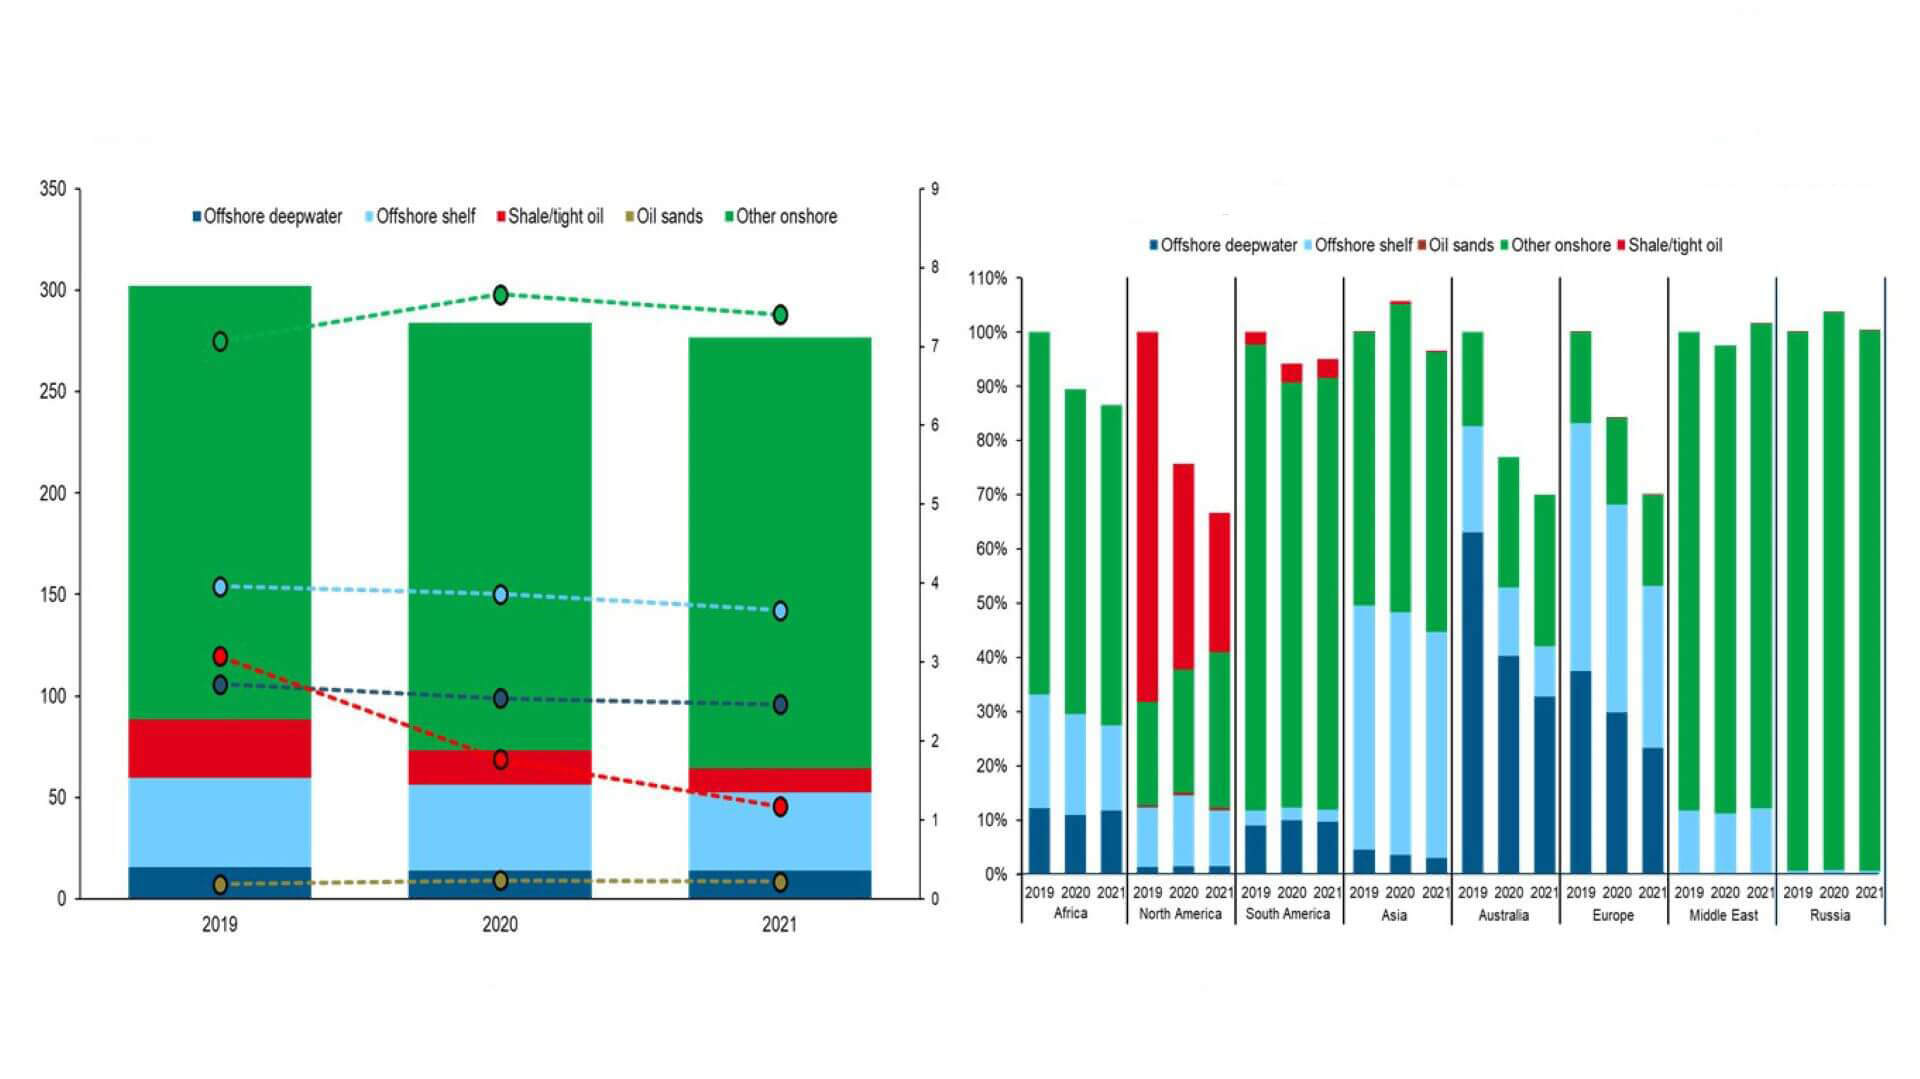 Fig 1: Global upstream flaring emissions by segment (mn tonnes CO2/kg of CO2 per boe) (left); and regional flaring overview compared to 2019 (right)
Source: Rystad Energy’s UCube, VIIRS Nightfire, Colorado School of Mines, Rystad Energy research and analysis